

+1 (332) 900-1500
In this article you will learn how to:
Note: Case creation estimate is set either by the Circle administrator or through the admin panel by your account manager.
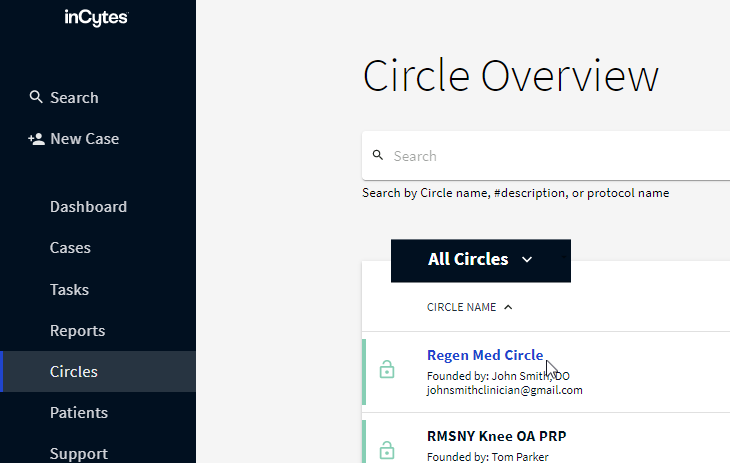
1. Go to Circles and select the required one from the list.
2. In the Circle Members field, click three dots next to the required Circle member and select Change cases estimate.

3. Enter the required number and click APPLY.
a. Enter the number equal or more than 0 (zero)

Caution: The monthly cases estimate and any changes made to it only apply to the current month. It is important to update the case estimate each month to ensure accuracy. Otherwise, the last entered number will automatically be applied to all subsequent months.
Note: The case creation estimate is specific to the Circle that you are viewing statistics for.
You can monitor case creation estimates for yourself, for the whole Circle or for each of your Circle members individually.
To do so,
1. Go to the Circles tab and select the required one from the list.
2. In the Circle Statistics, you’ll find the following info:

The case creation estimate on each Circle member individually can be found in the Circle Members section, column CASES ESTIMATE:

To evaluate if the Circle members are creating the expected level of the cases:
1. Go to Circles and select the required one from the list.
2. In the
Circle Analytics
field, select Compliance and Adherence → CASES.

On the graph you will see two columns for each period:
Note: Statistics include only active and completed cases. Archived cases are not included.
Blue column - My Cases - reflects all active cases created by you for this Circle during the given month
Black column - All Circle Cases – reflects all active cases created by all the Circle members (including your cases as well) for this Circle during the given month
Tip: You can switch off/on the required column on the graph by clicking the corresponding eye icon on the right of the graph

3. Hover your mouse over the required column to see the actual and the expected number of created cases.
For example, looking at the image, we can see that 21 cases have been created, while the expected number of cases to be created is 25, resulting in a completion rate of 84%.

The numbers in actual cases are displayed in different colors:
black if Actual number of created cases is less than Expected up to 29%
green if Actual number of created cases is equal or more than Expected
Search keywords:
Tomorrow's Healthcare Decisions. Todays's Real World Evidence.
