

+1 (332) 900-1500
1. Click Settings at the top right of the Report Builder.

2. Click next to the Y axis field

3. Select the desired parameter for the Y axis from the suggested list
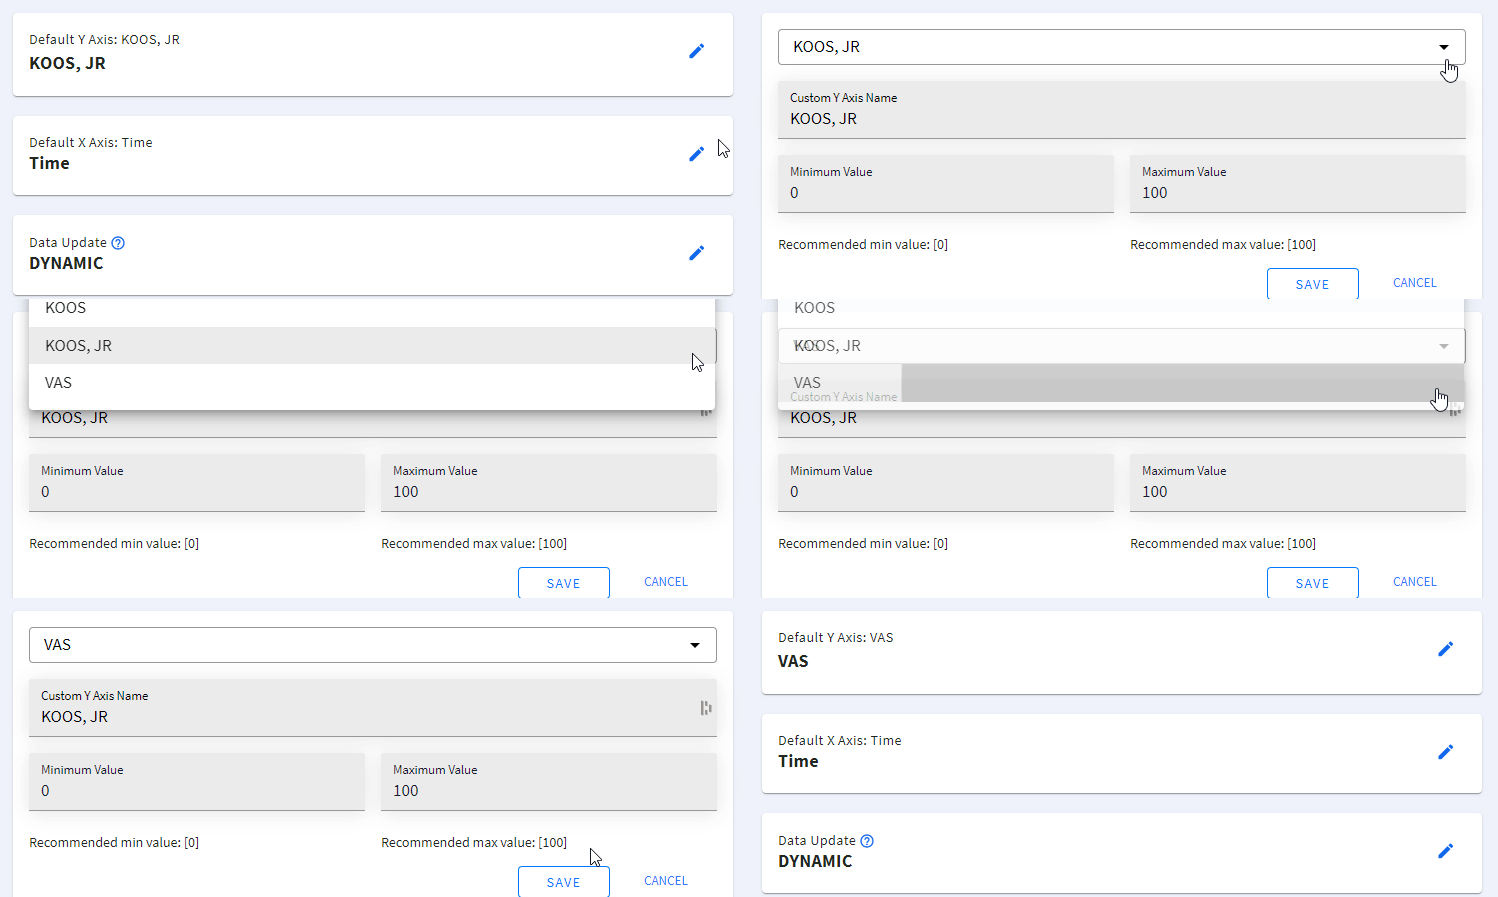
4. Customize the Y axis name if required
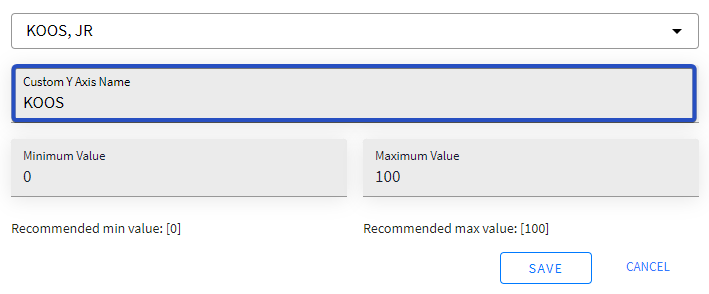
Note: After saving your custom Y axis name, you’ll see the default/system Y axis name above it.
5. Set Minimum and Maximum Values to display on the graph

6. Click SAVE to apply your changes to the graph (or CANCEL to cancel the action)
Search keywords:
Tomorrow's Healthcare Decisions. Todays's Real World Evidence.
