

+1 (332) 900-1500
In this article you will find:
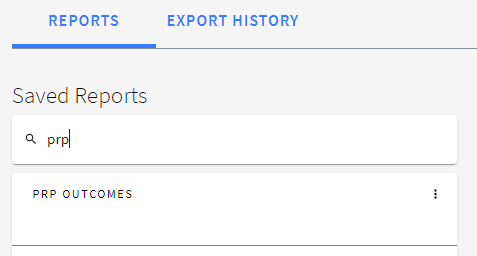
Tip: Use Search to find the required report in the list
3. Click EDIT at the top right of the screen

NOTE: To make sure the latest data is included in your report, click at the top right of the screen


3. Once the report has opened, click Export in the top right corner to initiate data export.

Tip: Feel free to move to any other tab if required. When the report is ready, you’ll see a notification banner at the top of the page.

Clicking VIEW on the banner will take you directly to the EXPORT HISTORY tab where you can find your report at the top of the reports list and download it.
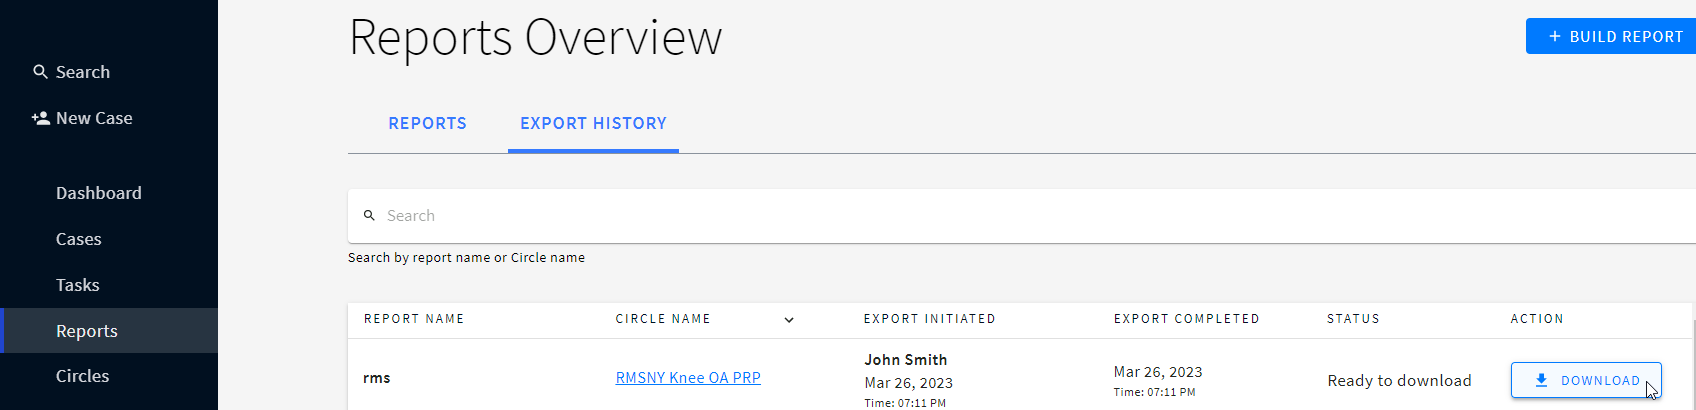
You can click CLOSE on the banner to close it and access your report later.
All the Report Builder and Circle raw data exports are stored in the EXPORT HISTORY of the Reports tab.
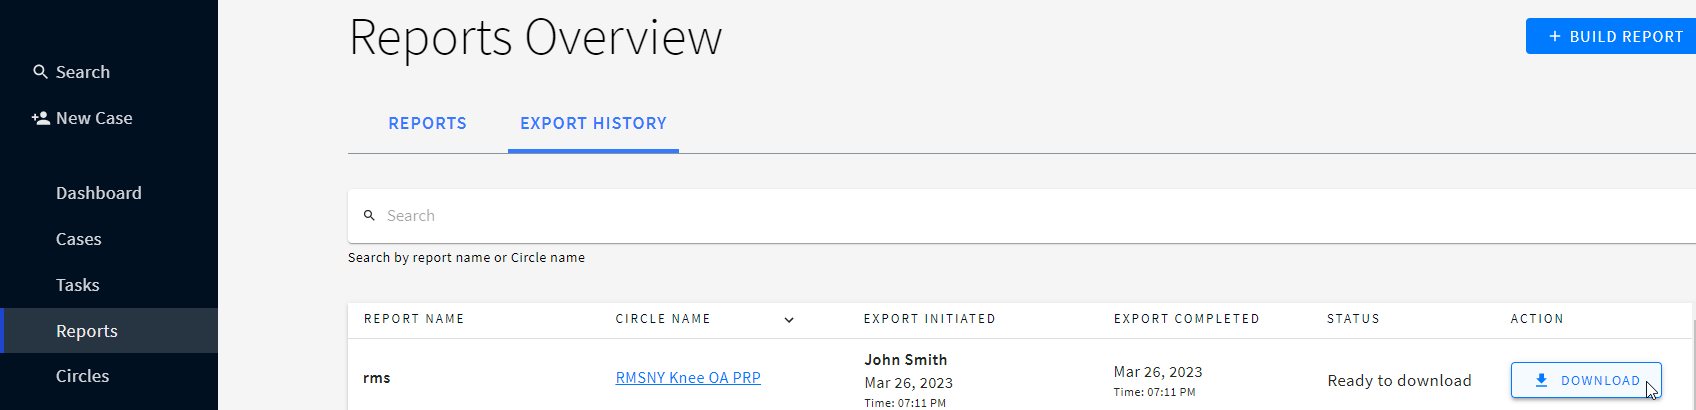
There’s a table where you can find the details of your report:
Tip: Click the arrow near the required column to put the items in the ascending / descending order.
Initially, the sorting is applied only to the visible results (about 25 items). To see the whole list, scroll down the page in order to load the rest (missing) items and then sort them.

Note: To get the latest data in the report, re-export it.
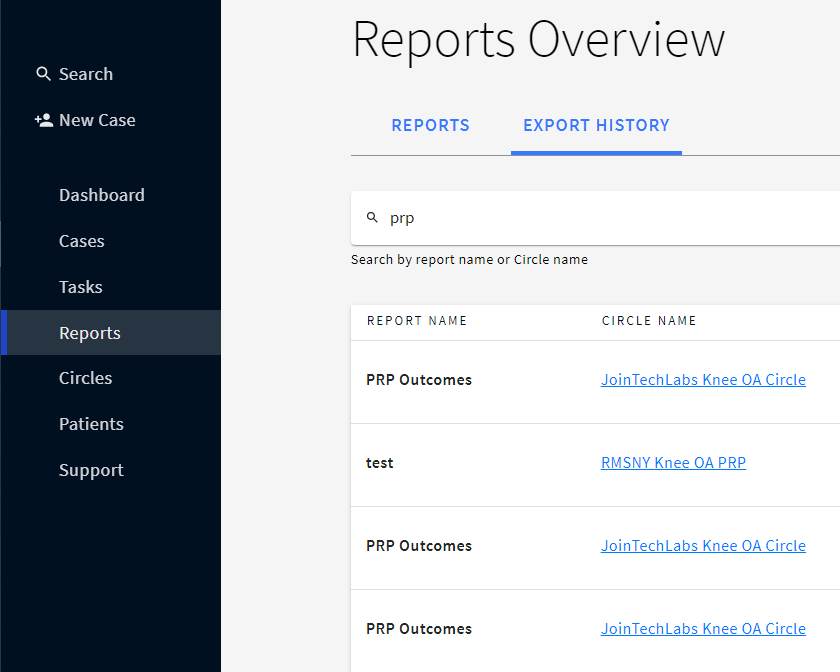
3. Click DOWNLOAD next to the required report to download it on your device in the .xlsx format
Warning: Reports Troubleshooting
• If the latest cases are not included in the report, re-export the report.
• If you don’t see PI data and/or the data of other Circle members in the report, your access to these data could have been limited. Contact your Circle administrator for more details.
• If you were granted access to the data, re-export the report to see the missing info.
• If the access to PI data was disabled, you won’t see the PI data when downloading the existing report.
The data ownership level can be adjusted for Circle administrator and Circle members to make PI data visible/non-visible in the exported Excel report.
In the Excel report, you’ll find the information on each case selected in the Cohort (1 tab = 1 cohort), and a tab with the Legend to understand the report.
Caution: *the visibility depends on the data ownership settings
Survey-related info (each survey has a code put at the beginning of the column header):

• SG: Scoring group score - the result of the scoring group selected as Y axis for the graph

Example: S217QT1Q569, where
S217 - Survey title (“Demographic and Diagnostic Survey”)
QT1 - Single selection question
Q569 - question “Smoking status?”

The Legend information is presented as follows:
Survey keys and their names

Keys to Scoring groups and their names

Keys to the questions, where:
Note: The questions in the legend go in the same order as in the protocol.

1. Key column presents the key of the question:
S - number of a Survey
| S217 | Diabetic Foot Syndrome Pre-Treatment Demographic and Diagnostic Survey |
QT - Question type number (the number is static):
QT1- Single Selection
QT2 - Multiple Selection
QT3- Group Question
QT5 - Text
QT6 - Number
QT7 - Date
QT9 - Analog
QT10 - Image
QT11- PDF
Q (Q- 962) - question number
2. Survey
name
3. Question type
4. Question
name
5. Additional Information
: indicates the units of measurements or the answer options to the question
Search keywords:
Tomorrow's Healthcare Decisions. Todays's Real World Evidence.
